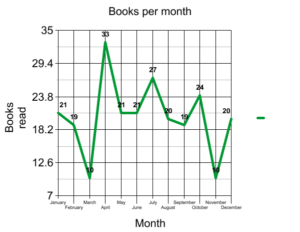
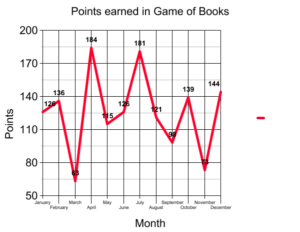
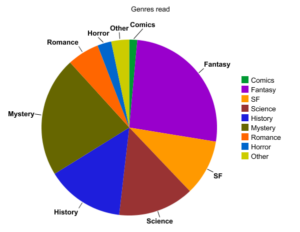
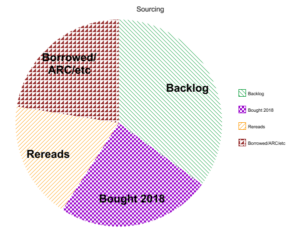
A belated happy new year to all of you! 2018 was a heck of a year which saw me completing a degree (for the third time), moving in with my wife permanently in the UK, and getting a new job (jobs, even!). Perhaps not surprisingly, I’ve read less this year on an average books-per-day basis than ever since I started tracking. Last year I did some neat graphs using this site, so let’s go again! You can click each graph to see it larger; last year’s stats are here.
Other stats:
Total read: 245
Number of rereads: 45
Total page count: 73,891 (+17,005 from last year)
Most-read genre per month:
- January: Fantasy
- February: Fantasy
- March: History
- April: Fantasy
- May: SF & Fantasy (tied)
- June: Fantasy
- July: Fantasy
- August: Fantasy & Mystery (tied)
- September: Mystery
- October: Fantasy
- November: History
- December: Mystery
Number of ratings:
- Five stars: 21
- Four stars: 124
- Three stars: 75
- Two stars: 23
- One star: 2
First book read: The Unbelievable Gwenpool: Believe It (Christopher Hastings)
Last book read: Greenwitch (Susan Cooper)
First book bought: The Hidden People (Alison Littlewood)
Last book bought: The Golden Thread (Kasia St Clair)
So pretty much no surprises here, and only minor changes year-on-year. The biggest changes have been in my consumption of science non-fiction (down this year) and mysteries (up this year). I’ve done a little more rereading, and maybe a little more reading from my backlog. Game of Books and the number of books I read are actually more closely related to each other this year, but despite reading fewer books overall, I read way more pages this year. So, Game of Books has been a success!
Overall I read less this year, of course, but I can report that the value (mostly based either on what I paid for the book, or RRP) of the books I read was way in excess of what I actually spent on books this year, so I’ve been making good use of libraries and my backlog!


I always like these stats pages with graphs and charts! They are so much more interesting to look at than lists of stats. I’m toyong with the idea of doing a monthly graphic post but I haven’t thought out the details yet. If I did a graph for my reading patterns it would start high and have serious troughs in it!
TOYING!!! Jeez! My spelling is terrible today, sorry!
chucklesthescot recently posted…Chuckles Cover Love #107-Justin Sloan
I’m not a very visual person, but it is interesting to see sometimes! I’ve got a spreadsheet that’s making a whole bunch of charts for me as I go along, so maybe I’ll do more as we go through the year!